


ARCHER Image Competition 2015 Gallery
-
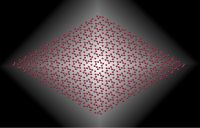
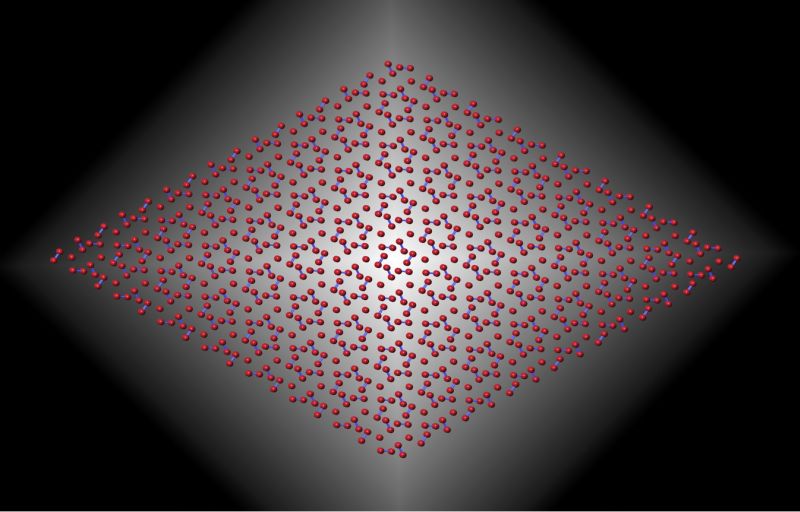
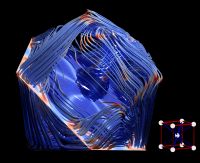
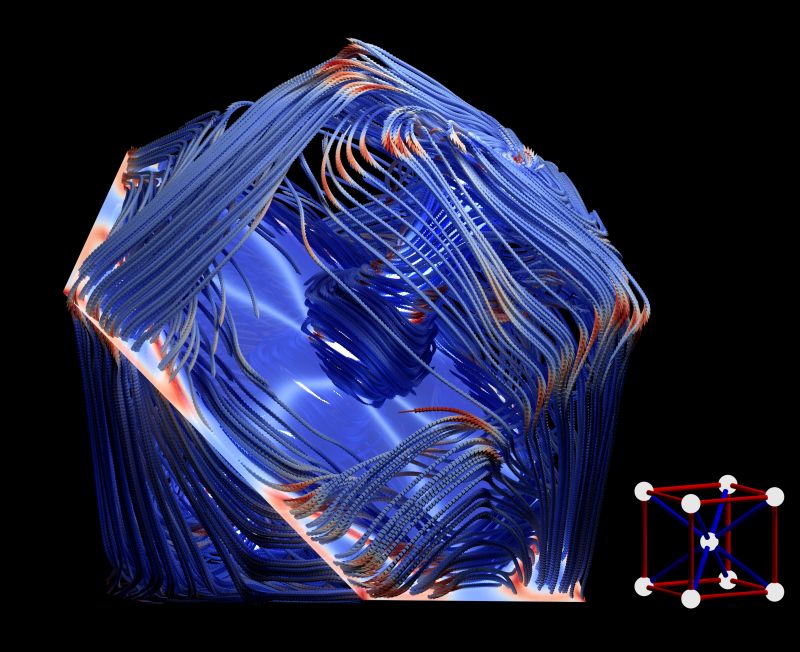
1. Crystal Structure of Solid Hydrogen.
1. Crystal Structure of Solid Hydrogen.
Dr Sam Azadi, Imperial College London.
If hydrogen gas is compressed, it solidifies to form a crystal of H2 molecules - the simplest and most fundamental of all molecular crystals. As the pressure is increased the crystal of hydrogen undergoes several phase transitions, but hydrogen atoms scatter X-rays so weakly that the structures of the new phases are unknown. This photo illustrates a crystal structure of solid hydrogen which is predicted by theoretical and computational methods. Eventually, at high enough pressures, hydrogen is predicted to become not only a metallic atomic solid (believed present in large quantities in the interiors of Saturn and Jupiter) but also a high-temperature superconductor and perhaps a superfluid. How does crystalline hydrogen progress from an insulating molecular solid to a metallic monatomic solid as the pressure is increased? This question has been with us since 1935 but remains unanswered: it is no exaggeration to say that it is the central preoccupation of high-pressure physics.
-

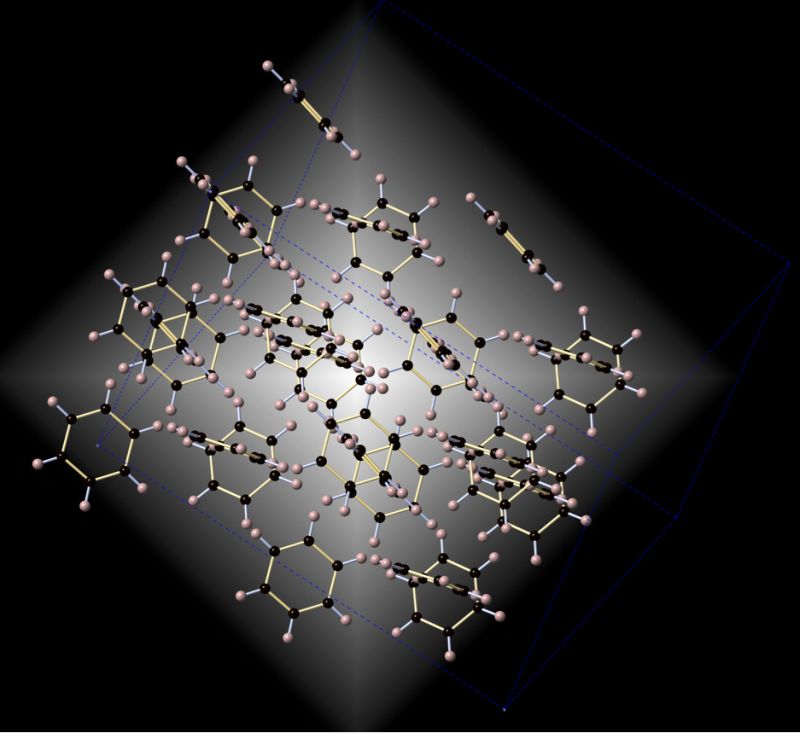
2. Crystal Structure of Solid Benzene.
2. Crystal Structure of Solid Benzene.
Dr Sam Azadi, Imperial College London.
Molecular crystals, including organic and inorganic, play vital role in understanding the physics and chemistry of the Earth and planets. Low-Z molecular systems are among the most abundant in the solar system, as represented by planetary gases and ices. Their behaviour at high pressures is crucial for modelling the structure, dynamic and evolution of the large planets. More over, compression of molecular systems provides the opportunity of forming new materials, possibly with novel properties such as high-temperature superconductivity, disordered and amorphous materials, and superhardness structures. This photograph shows the crystal structure of solid benzene which is the simplest organic molecular solid. Crystalline benzene phase diagram is a big challenge for theoretical and computational methods. To distinguish between crystal phases and competing low-energy polymorphs, the lattice energy calculations require very high accuracy.
-
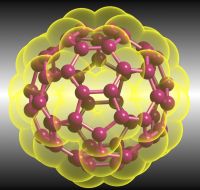
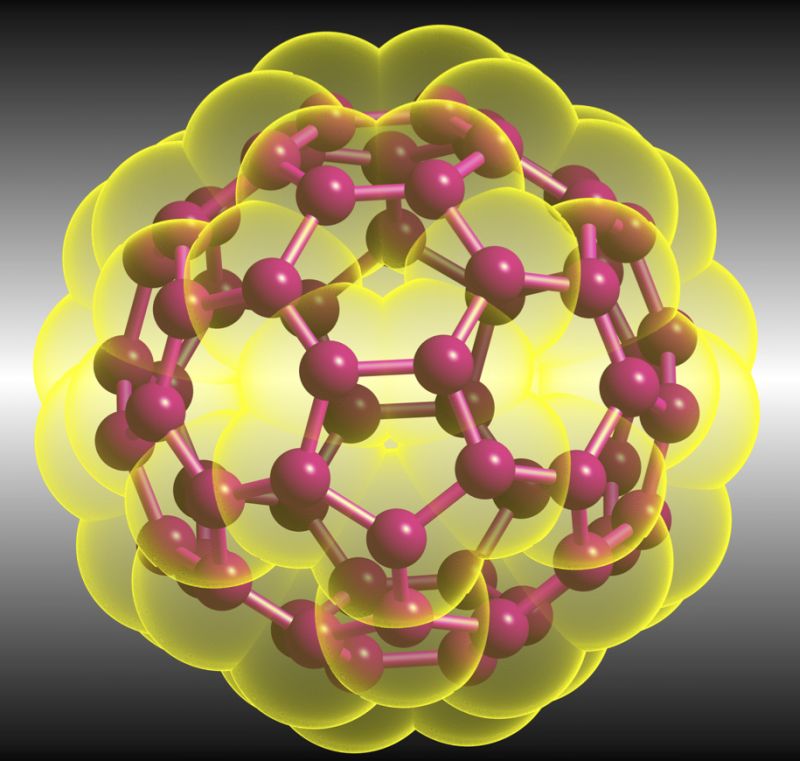
3. Electron charge cloud around Buckyball.
3. Electron charge cloud around Buckyball.
Dr Sam Azadi, Imperial College London.
Fullerene: the 60-carbon-atom cluster C60 called Fullerene (Buckyball to the general public) and its 70-atom cousin C70 are the most talked-about discovery in materials since high-temperature superconductors. Experimentalists have shown that solids based on buckyballs can be insulators, conductors, semiconductors or even superconductors when doped with other atoms or molecules. Pure buckyball solids form crystal structures, like graphite or diamond that are insulators or semiconductors. However when doped with an alkali metal, such as potassium or rubidium, these solids can become electricity-conducting metals. This photo shows the electron cloud around Buckyball, which plays crucial role in study of metal-insulator transition in these materials.
-
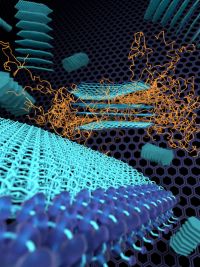
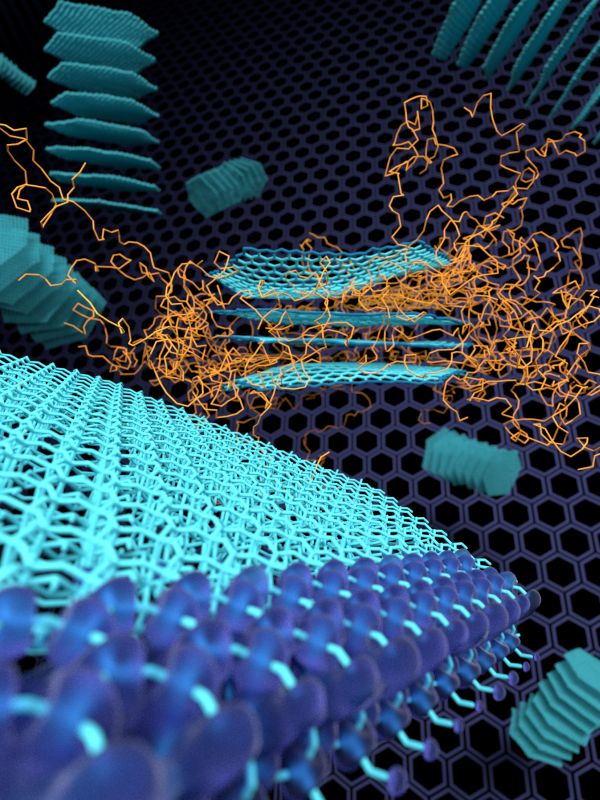
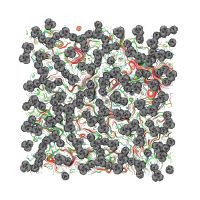
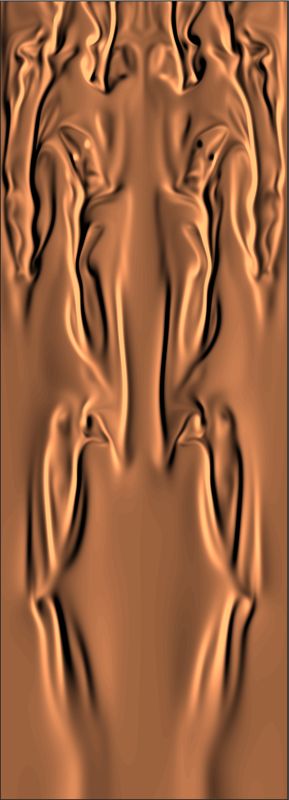
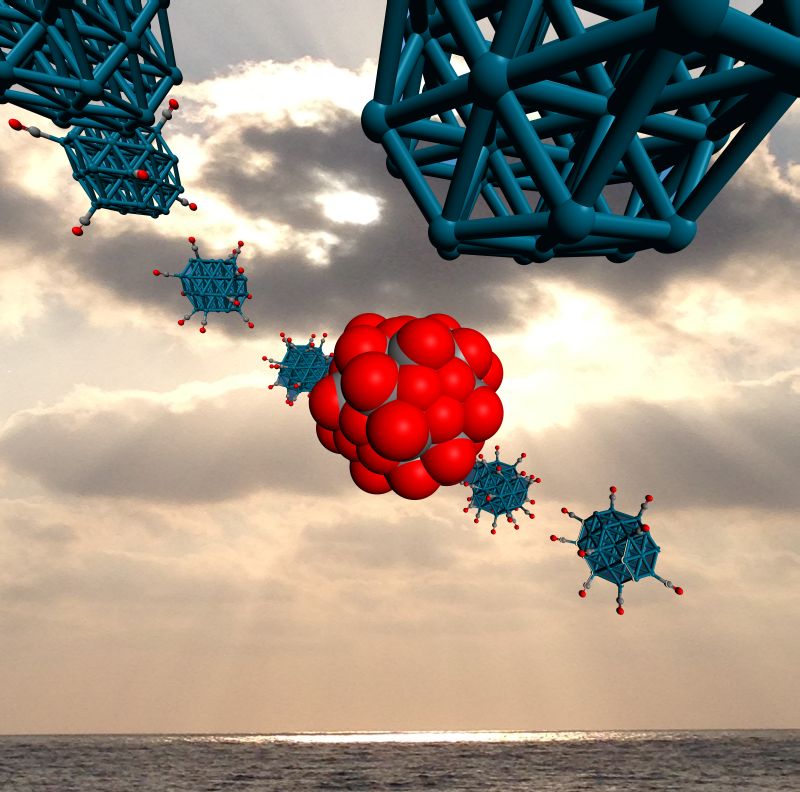
4. Polymeric nanocomposite materials.
4. Polymeric nanocomposite materials.
Dr Hugh Martin, University College London, Department of Chemistry.
We combine large-scale and small-scale computer models to show how polymers intermix with very large, but very thin, clay sheets to form polymeric nanocomposite materials. They use quantum mechanics, a very expensive technique, to accurately determine the force field around the edge of the clay. To make the simulation of full sheets possible (and affordable), they use more approximate models (atom-based and so-called "coarse-grained" molecular dynamics). The polymers are shown in orange, and the sheets in cyan. They are the first to show how polymer molecules enter between the clay sheets to create a hybrid structure with unique material properties, using a computer model where the clay sheets, their edges and their flexible surfaces, are fully taken into account. They aim to systematically model a range of these materials, thereby helping experimental specialists to identify candidate materials for (more expensive and time-consuming) experimental testing.
-
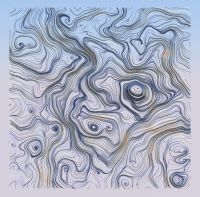
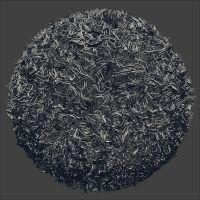
5. Flow visualisation through periodic boxes
5. Flow visualisation through periodic boxes
Dr Matthieu Chavent, University of Oxford, SBCB Group, Department of Biochemistry.
The cell membrane is a complex and crowded environment with different types of molecules such as lipids and proteins which are in a dynamic equilibrium. To try to better understand this dynamic behaviour, it is possible to develop theoretical models mimicking this membrane. Animating such models can be very challenging. Thus we used calculations launched on ARCHER computer to see how the constituents of this membrane interact together. Inspired by approaches in physics to depict wind or ocean currents we developed a new way to display collective movements of lipids molecules constituting the membrane model (http://sbcb.bioch.ox.ac.uk/flows/). This visualization allows displaying flow-like movements of lipids. To simulate an infinite system, the unit cell in the center is repeated in all the directions. We can see that the flows extend from one box to the other to create large vortices.
-
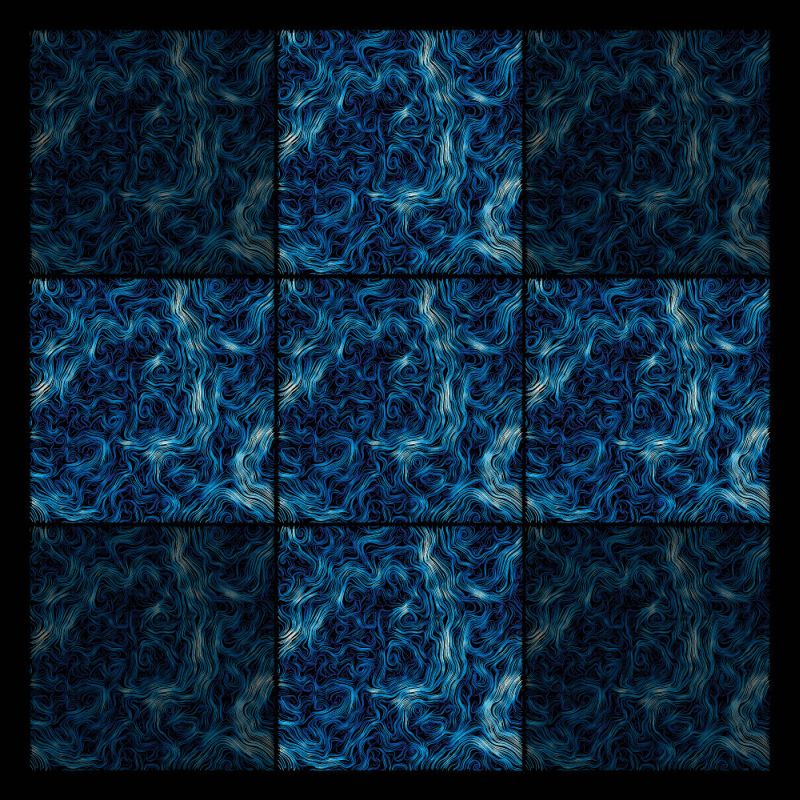
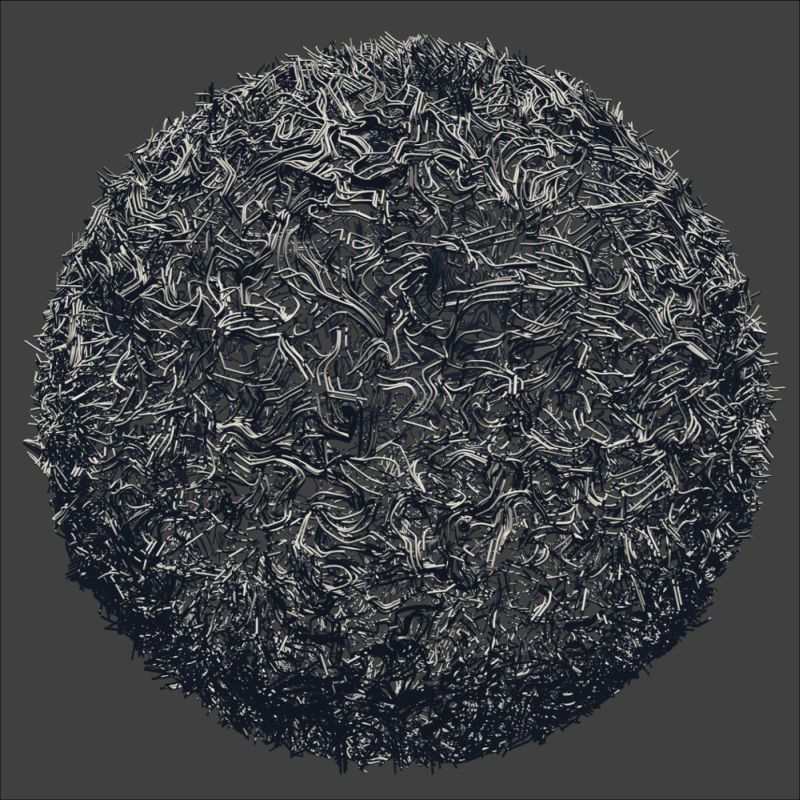
6. Flow visualisation in 2D
6. Flow visualisation in 2D
Dr Matthieu Chavent, University of Oxford, SBCB Group, Department of Biochemistry.
The cell membrane is a complex and crowded environment with different types of molecules such as lipids and proteins which are in a dynamic equilibrium. To try to better understand this dynamic behaviour, it is possible to develop theoretical models mimicking this membrane. Animating such models can be very challenging. Thus we used calculations launched on ARCHER computer to see how the constituents of this membrane interact together. Inspired by approaches in physics to depict wind or ocean currents we developed a new way to display collective movements of lipids molecules constituting the membrane model (http://sbcb.bioch.ox.ac.uk/flows/). This visualization allows displaying flow-like movements of lipids like vortices. Blue: low velocity flow, red: high velocity flow. Image made with Paraview and rendered with Blender.
-

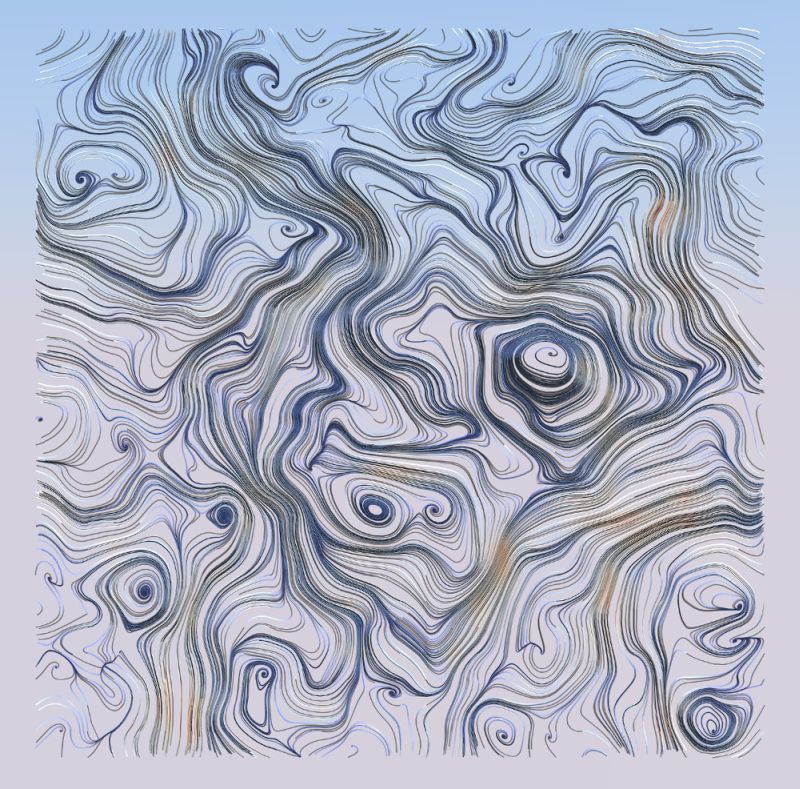
7. Flow visualisation of a membrane bilayer
7. Flow visualisation of a membrane bilayer
Dr Matthieu Chavent, University of Oxford, SBCB Group, Department of Biochemistry.
The cell membrane is a complex and crowded environment with different types of molecules such as lipids and proteins which are in a dynamic equilibrium. To try to better understand this dynamic behaviour, it is possible to develop theoretical models mimicking this membrane. Animating such models can be very challenging. Thus we used calculations launched on ARCHER computer to see how the constituents of this membrane interact together. Inspired by approaches in physics to depict wind or ocean currents we developed a new way to display collective movements of lipids molecules constituting the membrane model (http://sbcb.bioch.ox.ac.uk/flows/). This visualization allows displaying flow-like movements of lipids. The membrane is a bilayer and we can see that the superimposition of the two leaflets (left and right) can highlight correlated area of motion (centre). Dark colour low velocity flow, light colour/white: high velocity flow.
-
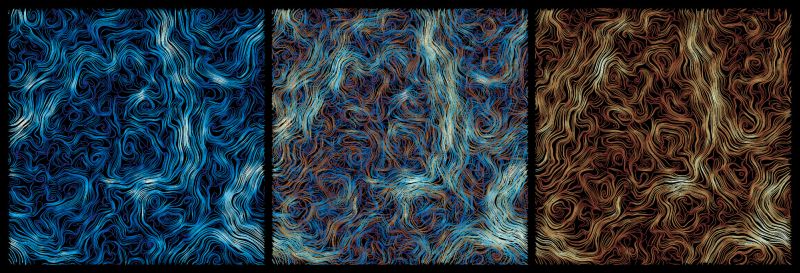
8. Flow visualisation of vesicle model
8. Flow visualisation of vesicle model
Dr Matthieu Chavent, University of Oxford, SBCB Group, Department of Biochemistry.
The cell membrane is a complex and crowded environment with different types of molecules such as lipids and proteins which are in a dynamic equilibrium. To try to better understand this dynamic behaviour, it is possible to develop theoretical models mimicking this membrane. Animating such models can be very challenging. Thus we used calculations launched on ARCHER computer to see how the constituents of this membrane interact together. Inspired by approaches in physics to depict wind or ocean currents we developed a new way to display collective movements of lipids molecules constituting the membrane model (http://sbcb.bioch.ox.ac.uk/flows/). This visualization allows displaying flow-like movements of lipids in a vesicle model (made by Dr Tyler Reddy: goo.gl/KO7lrU). Image made with Paraview and rendered with Blender.
-

9. Flow visualisation of vesicle model
9. Flow visualisation of vesicle model
Dr Matthieu Chavent, University of Oxford, SBCB Group, Department of Biochemistry.
The cell membrane is a complex and crowded environment with different types of molecules such as lipids and proteins which are in a dynamic equilibrium. To try to better understand this dynamic behaviour, it is possible to develop models mimicking this membrane. Animating such models can be very challenging. We used calculations launched on ARCHER computer to see how the constituents of this membrane interact together. Inspired by approaches in physics to depict wind or ocean currents we developed a new way to display collective movements of lipids molecules constituting the membrane model (http://sbcb.bioch.ox.ac.uk/flows/). Visualization of the lipid flows in a protein crowded systems. This allows to model the movement of lipids when the proteins are clustered together forming channels guiding the flow of lipids. This extends previous model combining both experimental and theoretical results (goo.gl/1LAUmd). Rendering with VMD (http://www.ks.uiuc.edu/Research/vmd/). Gray: membrane proteins. Red: high-velocity flow; green: low-velocity flow.
-
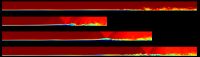
10. Oblique-mode breakdown "on sand". Contour levels of wall-normal vorticity for a horizontal plane at a small distance from the wall.
10. Oblique-mode breakdown "on sand".
Dr Andrea Sansica, University of Southampton, Department of Aerodynamics and Flight Mechanics.
High-fidelity direct numerical simulations represent the
richest source of information in computational fluid
dynamics. The computing effort needed to resolve all the
significant spatial and temporal scales is however enormous
and often prohibitive. The computational resources available
in ARCHER allow numerical meshes of hundreds of millions
of points and made possible to study fundamental flow
configurations that only 10-15 years ago were simply
unimaginable.
The interest is here focused on transition to turbulence and
its effect on the structure of interaction between a shockwave
and a supersonic boundary-layer. The figure describes
the oblique-mode boundary-layer transition scenario that
occurs at a Mach number of 1.5 downstream of the
impingement shock-wave location.
-
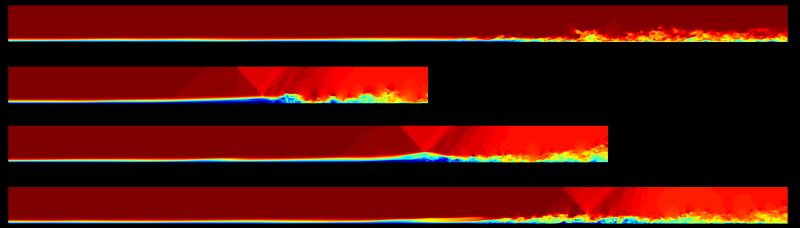
11. Vertical planes of streamwise velocity for a supersonic boundary-layer without (top plot) and with shock interaction at three different impingement locations (bottom three plots).
11. Vertical planes of streamwise velocity for a supersonic boundary-layer.
Dr Andrea Sansica, University of Southampton, Department of Aerodynamics and Flight Mechanics.
High-fidelity direct numerical simulations represent the
richest source of information in computational fluid
dynamics. The computing effort needed to resolve all the
significant spatial and temporal scales is however enormous
and often prohibitive. The computational resources available
in ARCHER allow numerical meshes of hundreds of millions
of points and made possible to study fundamental flow
configurations that only 10-15 years ago were simply
unimaginable.
The interest is here focused on the impingement location
effect of a shock-wave onto a supersonic boundary-layer
that is experiencing transition to turbulence at a Mach
number of 1.5. The presence of the shock-wave accelerates
transition and different structures of interaction exist
depending on the nature of the boundary-layer at the
impingement location.
-
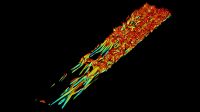

12. Iso-surfaces of Q-criterion coloured with the streamwise velocity for a non-thermal plasma counter-flow actuator with serpentine-shaped electrodes.
12. Iso-surfaces of Q-criterion coloured with the streamwise velocity for a non-thermal plasma counter-flow actuator with serpentine-shaped electrodes.
Dr Andrea Sansica, University of Southampton, Department of Aerodynamics and Flight Mechanics.
High-fidelity direct numerical simulations represent the
richest source of information in computational fluid
dynamics. The computing effort needed to resolve all the
significant spatial and temporal scales is however enormous
and often prohibitive. The computational resources available
in ARCHER allow numerical meshes of hundreds of millions
of points and made possible to study fundamental flow
configurations that only 10-15 years ago were simply
unimaginable.
A non-thermal plasma actuator is used to trigger transition
to turbulence in a supersonic boundary-layer. The
introduction of serpentine-shaped electrodes destabilises
the boundary-layer more efficiently and transition occurs
earlier. Compared to classical straight-edged electrodes, the
serpentine-electrodes demonstrate improved capabilities on
the reduction of energy consumption.
-

13. Coverage-dependent IR simualtions of CO adsorption on a palladium nanoparticle
13. Coverage-dependent IR simualtions of CO adsorption on a palladium nanoparticle
Dr Constantinos Zeinalipour-Yazdi, University College London, Department of Chemistry.
Spectroscopic techniques such as infrared absorption or transmission spectroscopy can yield quantitative and qualitative information about the structure of nanomaterials used in catalysis. In this computational study we have used ARCHER resources to establish a general framework for IR simulations of nanoparticles obtained during the adsorption of CO as a function of coverage. This research was featured in a recent article published in Surface Science with collaborating research groups from Cardiff, Birmingham and London.
-
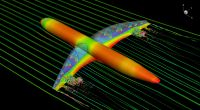
14. Delayed detached-eddy simulation of a large civil aircraft in transonic flow
14. Delayed detached-eddy simulation of a large civil aircraft in transonic flow
Dr Sebastian Timme, University of Liverpool, Department of Engineering.
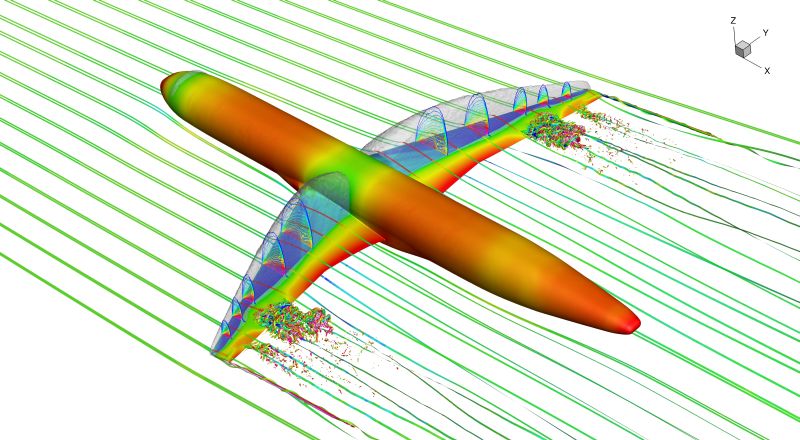
The image illustrates the phenomenon of shock buffet in the transonic flow around a large civil aircraft. The surface pressure
distribution highlights the strong shock wave forming over the wings, acting to separate the boundary layer and resulting in large-scale
turbulent eddies. Streamlines indicate the disturbed airflow in the wake behind the wings.
Understanding shock buffet is important in aircraft design as the resulting structural vibrations and unsteady aerodynamic loads
limit the flight envelop. The data shown in the figure is the result of six coupled nonlinear equations solved at 29 million points
for over 100,000 time steps. This enormous computational task would not have been possible without access to ARCHER through the EPSRC Resource Allocation Panel.
-
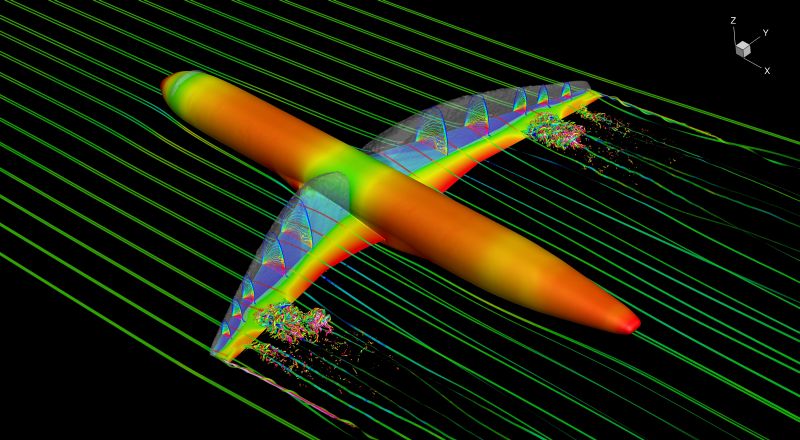
15. Delayed detached-eddy simulation of a large civil aircraft in transonic flow
15. Delayed detached-eddy simulation of a large civil aircraft in transonic flow
Dr Sebastian Timme, University of Liverpool, Department of Engineering.
The image illustrates the phenomenon of shock buffet in the transonic flow around a large civil aircraft. The surface
pressure distribution highlights the strong shock wave forming over the wings, acting to separate the boundary layer and
resulting in large-scale turbulent eddies. Streamlines indicate the disturbed airflow in the wake behind the wings.
Understanding shock buffet is important in aircraft design as the resulting structural vibrations and unsteady aerodynamic
loads limit the flight envelop. The data shown in the figure is the result of six coupled nonlinear equations solved at 29
million points for over 100,000 time steps. This enormous computational task would not have been possible without access to
ARCHER through the EPSRC Resource Allocation Panel.
-

16. Ultrafast electron recollisions in benzene
16. Ultrafast electron recollisions in benzene
Dr Daniel Dundas, Queen's University Belfast, Atomistic Simulation Centre.
We describe how molecules behave when ultrafast laser pulses illuminate them. In this case the laser light is so strong that it breaks the molecule apart. We are particularly interested in understanding if the laser can be used to control how the molecule breaks apart, acting like a molecular scissors. The calculations we perform on ARCHER are very demanding. We describe how the molecule breaks apart using quantum mechanics and this means that even the smallest calculation uses around 1000 cores for over 12 hours. In the image we see how the electrons in the benzene molecule are blown off when the laser light hits them. Since we use quantum mechanics, the electrons behave like waves and we see these waves sloshing back and forth across the molecule as the laser drives them.
-
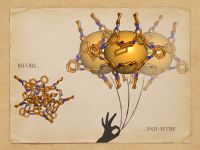

17. Inflation of a porous organic cage.
17. Inflation of a porous organic cage.
Ms Valentina Santolini, Imperial College London.
Porous organic cages are defined as a collection of molecules assembled in the shape of a cage. They are characterised by the presence of a cavity which is able to host smaller molecules. In recent work we tried to simulate the scaffolding effect of solvent (symbolically represented by the yellow sphere inside the cages on the right end side) within porous organic cages. On the left hand side of the image we show an example cage before we simulate the effect of the solvent. There, the cage is in its "collapsed" state, as it lacks the internal cavity. The collapsed state can methaphorically resemble a deflated balloon. Solvent molecules act as a scaffold opening up the structure. This leads to the "balloon" inflating when physical effects due to the solvent are included in the simulations.
-

18. Time-elapsed images of diffusion of tracer particles during turbulent convection. (Left) diffusive behaviour of particles selected to be initially outside of any strong convective plumes. (Right) diffusive behaviour of particles that are initially positioned closely together and inside a rising plume of hot fluid. Thermal fluctuations during turbulent convection are shown as contours, where blue represents cold flows and red represents hot flows. The particles are coloured in the same way by the hot or cold fluctuations that they experience in the flow.
18. Time-elapsed images of diffusion of tracer particles during turbulent convection.
Dr Jane Pratt, A. Busse and W.C. Mueller, University of Exeter, Department of Physics.
In natural systems like stellar interiors and planetary atmospheres flows are not constrained by convection rolls or boundary layers. As well as the structure of plumes in a flow, heat transfer is highly dependent on a fluid's Prandtl number, the ratio of viscosity to thermal diffusivity. In the solar convection zone thermal diffusivity dominates, and Prandtl numbers are estimated to be 3 to 5 orders of magnitude lower than can be achieved by modern simulations. A theoretical understanding of how turbulent heat transfer changes as the Prandtl number is lowered is key to effectively modelling convection. We have developed new methods of characterizing the heat transfer in and around plumes using higher order statistics and Lagrangian tracer particles. We calculate statistics of heat transfer from pseudospectral simulations of incompressible homogeneous Boussinesq hydrodynamic convection for the wide range of Prandtl numbers.
-
19. Visualising a magnetic recorder
19. Visualising a magnetic recorder
Mr Lesleis Nagy, University of Edinburgh, School of Geosciences.
Rocks contain naturally occurring magnets which record variations of the Earth's magnetic field. This image shows the result of simulating the magnetic microstructure within a grain of pure magnetite. Fidelity and stability of magnetic recording depends upon the fine variation of the direction of the magnetisation within the grain. In this image the magnetisation direction is highlighted using streamlines formed from small arrows that align with the magnetisation. The redder the colour the more an arrow points along a cube edge and the bluer, the more it points along a cube diagonal (inset). Streamlines of magnetisation can be seen to `spill out' from the central core and flow across the surface of the grain. The flat slice in the centre shows regions of uniform magnetisation called domains. These domains are separated by walls, shown by the light blue spokes within the plane, emanating from the slice's centre.
-

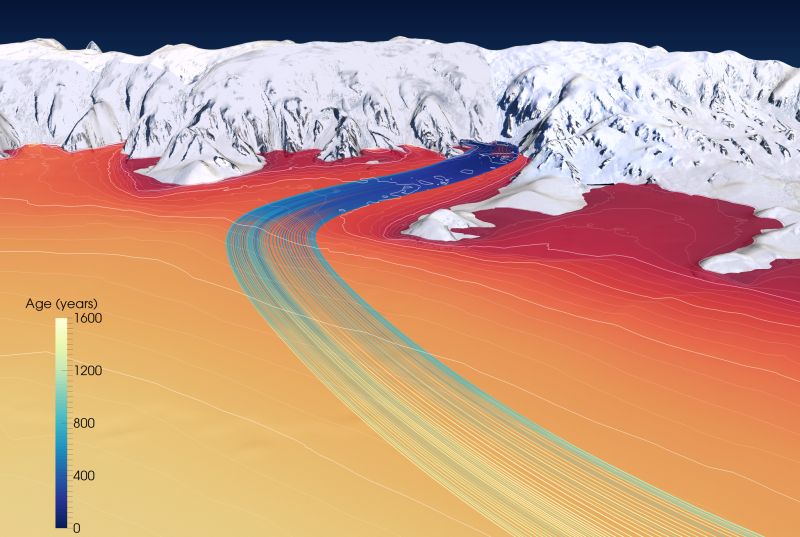
20. Flow and structure of the Larsen C ice shelf, Antarctica
20. Flow and structure of the Larsen C ice shelf, Antarctica
Dr Martin O'Leary, University of Swansea, Department of Geography.
The Larsen C ice shelf is an area of floating glacial ice in Antarctica, roughly two and a half times the size of Wales. A changing
climate has caused temperatures in this part of Antarctica to rise greatly over the past few decades, which has allowed meltwater to
seep into the ice, warming it and changing its material properties. Similar processes have already caused the collapse of the Larsen
A and B ice shelves. If Larsen C were to collapse, nearby glaciers would accelerate and thin, leading to a large contribution to sea level rise.
This image illustrates a band of ice flow originating in Cabinet Inlet, where field and satellite observations have found large meltwater
ponds. Using high-resolution numerical modelling on ARCHER, we are able to map how ice from this area is transported through the ice shelf,
and determine its future effects on the stability of Larsen C.
-
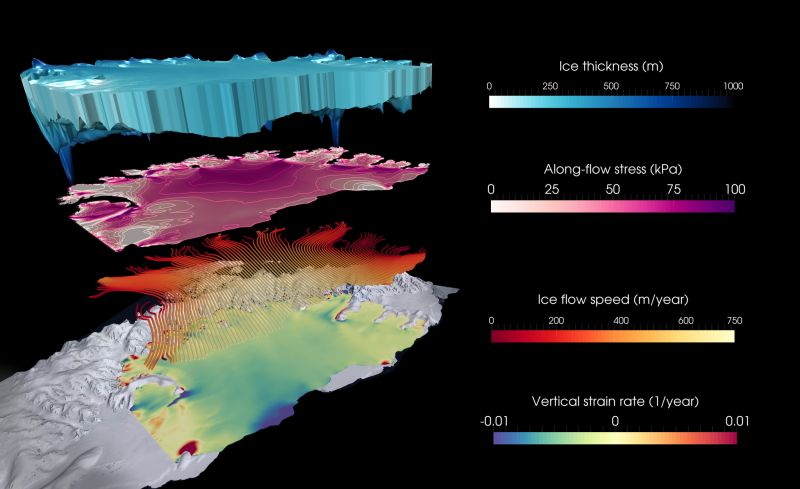
21. Flow and structure of the Larsen C ice shelf, Antarctica
21. Flow and structure of the Larsen C ice shelf, Antarctica
Dr Martin O'Leary, University of Swansea, Department of Geography.
The Larsen C ice shelf is an area of floating glacial ice in Antarctica, roughly two and a half times the size of Wales. A changing
climate has caused temperatures in this part of Antarctica to rise greatly over the past few decades, which has allowed meltwater to
seep into the ice, warming it and changing its material properties. Similar processes have already caused the collapse of the Larsen
A and B ice shelves. If Larsen C were to collapse, nearby glaciers would accelerate and thin, leading to a large contribution to sea level rise.
This image illustrates the flow of ice in Larsen C, along with the stresses being generated by its motion. Using high-resolution numerical
modelling on ARCHER, we are able to map these stresses, and predict the future evolution of the ice shelf.
-


22. Artistic representation of a proposed one-direction walking molecule on a metallic surface.
22. Artistic representation of a proposed one-direction walking molecule on a metallic surface.
Dr David Abbasi Pérez, King's College London, Department of Physics.
We are looking for molecules which tend to move on a surface towards one direction rather than to the opposite one. This is a property related to molecular machines. In order to achieve this we need to understand how molecules walk on the surface, computing their geometries, and the energy barriers the molecules have to overcome to get their new position. This is a very high-demanding computational task, and is where ARCHER plays its important role, allowing us to access to all that information by means of its very high computational power. The image is an artistic representation of one of these molecules moving along the surface, and was created using open-source codes like Jmol, Blender and The Gimp.
-
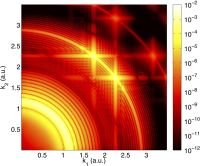
23. Momentum of electrons after ionisation of a Helium atom
23. Momentum of electrons after ionisation of a Helium atom
Mr Jack Wragg, Queen's University Belfast.
we're interested in electron behavior over short timescales. This knowledge allows us to work towards controlling chemical reactions,
making better lasers, and creating an 'attosecond video camera' that can see chemical reactions as they happen. We obtain results from
computer codes developed to model electrons in atoms.
The picture shows what happens when a helium atom absorbs enough energy from a laser pulse that two electrons leave the atom. It
shows the probability of each electron having momentum k_{1} and k_{2} as it moves away from the atom. Features of the way the
electrons absorb and then share energy from the laser pulse can be seen: the curved lines show when the energy is shared between
the electrons, and the straight lines show when this sharing doesn't happen. Modeling Two-Electron ionisation is a large task that
wouldn't be possible without the extended capabilities that ARCHER provides.
-

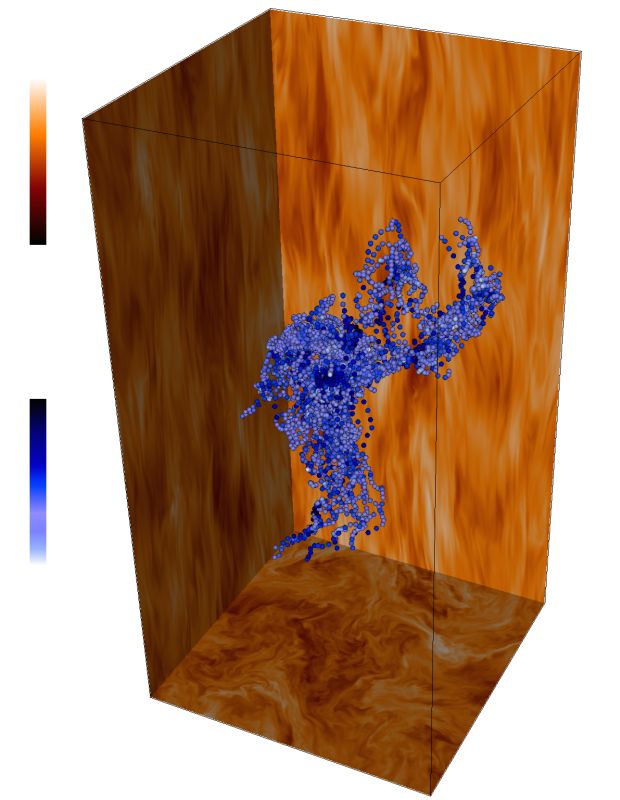
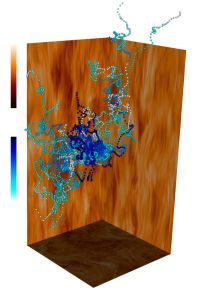
24. A time-elapsed image of diffusion of tracer particles in a turbulent, electrically conducting fluid. A strong magnetic field in the vertical direction causes an anisotropy in the flow and destabilizes large-scale waves. Magnetic energy in the system is shown in shades of orange. A small group of tracer particles is initially selected in the center of the simulation volume. The paths of the tracer particles are then shown as the particles diffuse. Particles are coloured according to their kinetic energy at each point in time, with darker shades of blue higher kinetic energy.
24. A time-elapsed image of diffusion of tracer particles in a turbulent, electrically conducting fluid.
Dr Jane Pratt, A. Busse and W.C.Mueller, University of Exeter, Department of Physics.
In the solar wind or in a fusion machine, a varying magnetic field can create turbulence that behaves two-dimensional in certain ways. We analyze this quasi-two-dimensionalization of turbulence from the Lagrangian perspective, based on direct numerical simulations of incompressible magnetohydrodynamic turbulence. The Lagrangian viewpoint follows the movement of tracer particles in an evolving flow, and naturally produces information about turbulent diffusion and dispersion, and the formation of flow structures. Our simulations calculate statistics from 16 million tracer particles. We find that diffusion and dispersion are strongly influenced by the presence and direction of the magnetic field.
-
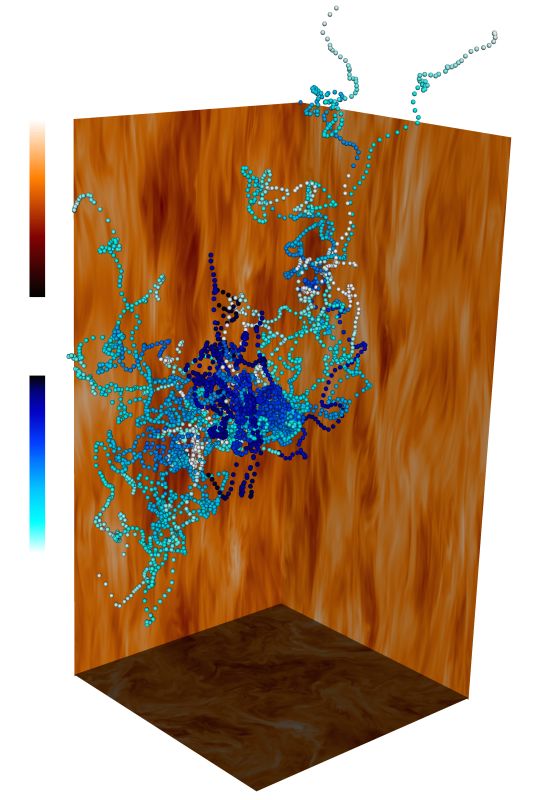
25. A time-elapsed image of diffusion of tracer particles in a turbulent, electrically conducting fluid. A strong magnetic field in the vertical direction causes an anisotropy in the flow and destabilizes large-scale waves. Magnetic energy in the system is shown in shades of orange. Tracer particles are selected that move through a small volume in the center of the simulation. The paths of the tracer particles are shown as the particles diffuse in and out of this volume. Particles are coloured according to time, with lighter shades of blue representing earlier points in the particles' paths.
25. A time-elapsed image of diffusion of tracer particles in a turbulent, electrically conducting fluid.
Dr Jane Pratt, A. Busse and W.C.Mueller, University of Exeter, Department of Physics.
In the solar wind or in a fusion machine, a varying magnetic field can create turbulence that behaves two-dimensional in certain ways. We analyze this quasi-two-dimensionalization of turbulence from the Lagrangian perspective, based on direct numerical simulations of incompressible magnetohydrodynamic turbulence. The Lagrangian viewpoint follows the movement of tracer particles in an evolving flow, and naturally produces information about turbulent diffusion and dispersion, and the formation of flow structures. Our simulations calculate statistics from 16 million tracer particles. We find that diffusion and dispersion are strongly influenced by the presence and direction of the magnetic field.
-
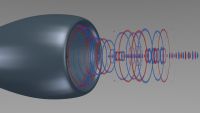
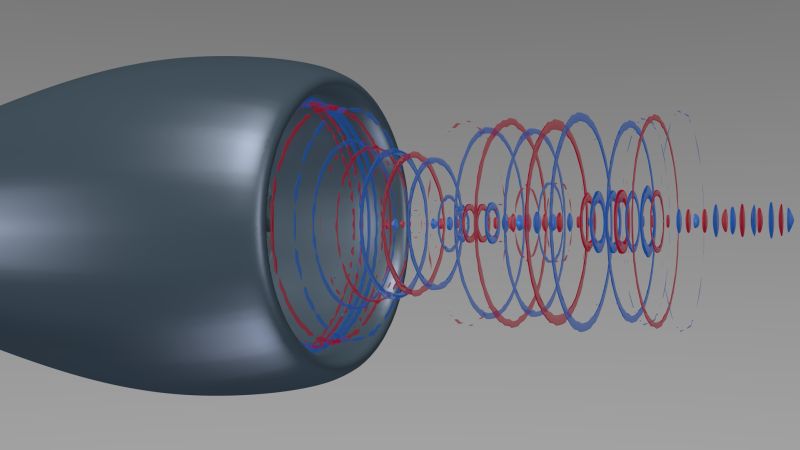
26. Propagation of a high frequency sound wave emanating from the fan of an aircraft engine
26. Propagation of a high frequency sound wave emanating from the fan of an aircraft engine
Mr Romain Futrzynski, KTH Farkost och Flyg, Stockholm.
The image shows the low and high pressure regions, respectively in blue and red, of a sound wave emanating from an aircraft engine's fan. Note how the curvature of the engine's nacelle distorts the wave as it propagates away from the fan. The acoustic field was simulated using the relatively new yet efficient "wave expansion method". Large calculations on Archer allowed to compute the precise sound level created by waves of many frequencies, up to several kilohertz, within a seven-meter radius around the fan. Such simulations simplify the integration of acoustics in the optimization of the engine's design, and should lead to quieter airplanes. Isosurfaces of the calculated pressure were created in Paraview, and rendered together with the nacelle using Blender.
-

27. Music, order and chaos in a combustion chamber
27. Music, order and chaos in a combustion chamber
Mr Ivan Langella, University of Cambridge, Department of Engineering.
This picture shows the flow inside a gas turbine combustion chamber computed using ARCHER. The swirling flow enters the
chamber from the left as indicated by the arrows and evolves to become chaotic in the early part of the chamber, where vortical
structures, colored by temperature, can be observed. A trumpet-like iso-pressure surface surrounded by this chaos is produced by
the flow accelerating towards the exit because of the interaction between flame and turbulence. One can see order emerging from
the chaos resulting in a beautiful flow structure. Understanding this interaction helps to construct "silent" combustors for
future environmentally friendly gas turbine engines.
Colors represent temperature (red - high, blue - low) for vortical structures and velocity vectors, and vorticity on the iso-pressure surfaces.
-

28. Music, order and chaos in a combustion chamber
28. Music, order and chaos in a combustion chamber
Mr Ivan Langella, University of Cambridge, Department of Engineering.
This picture shows the flow inside a gas turbine combustion chamber computed using ARCHER. The swirling flow enters the
chamber from the left as indicated by the arrows and evolves to become chaotic in the early part of the chamber, where vortical
structures, colored by temperature, can be observed. A trumpet-like iso-pressure surface surrounded by this chaos is produced by
the flow accelerating towards the exit because of the interaction between flame and turbulence. One can see order emerging from the
chaos resulting in a beautiful flow structure. Understanding this interaction helps to construct "silent" combustors for future
environmentally friendly gas turbine engines.
Colors represent temperature (red - high, blue - low) for vortical structures and velocity vectors, and vorticity on the iso-pressure surfaces.
-
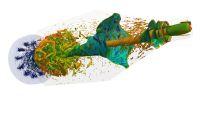
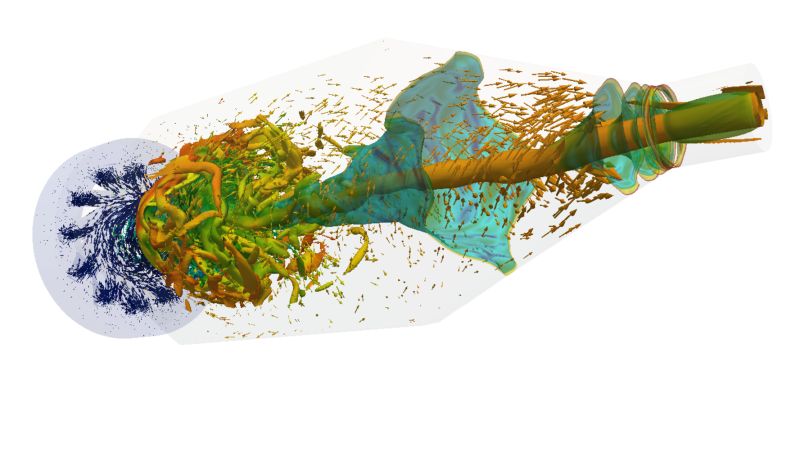
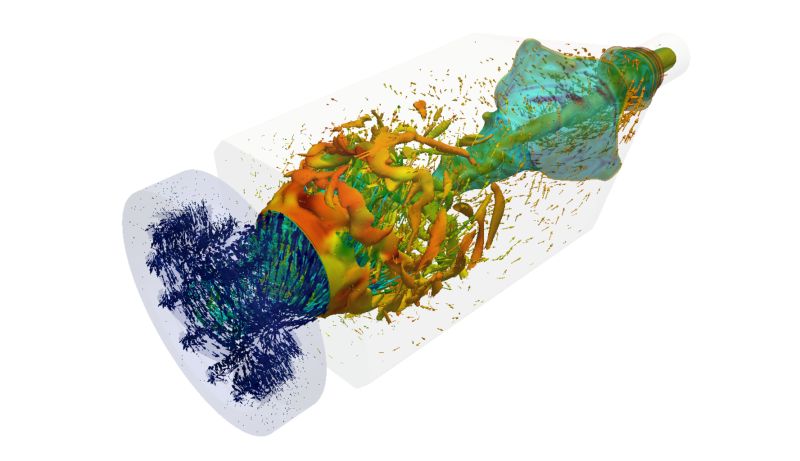
29. Music, order and chaos in a combustion chamber
29. Music, order and chaos in a combustion chamber
Mr Ivan Langella, University of Cambridge, Department of Engineering.
* * * COMPETITION WINNING ENTRY * * *
This picture shows the flow inside a gas turbine combustion chamber computed using ARCHER. The swirling flow enters the
chamber from the left as indicated by the arrows and evolves to become chaotic in the early part of the chamber, where vortical
structures, colored by temperature, can be observed. A trumpet-like iso-pressure surface surrounded by this chaos is produced by
the flow accelerating towards the exit because of the interaction between flame and turbulence. One can see order emerging from the
chaos resulting in a beautiful flow structure. Understanding this interaction helps to construct "silent" combustors for future
environmentally friendly gas turbine engines.
Colors represent temperature (red - high, blue - low) for vortical structures and velocity vectors, and vorticity on the iso-pressure surfaces.
-

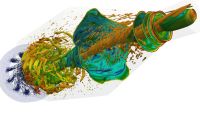
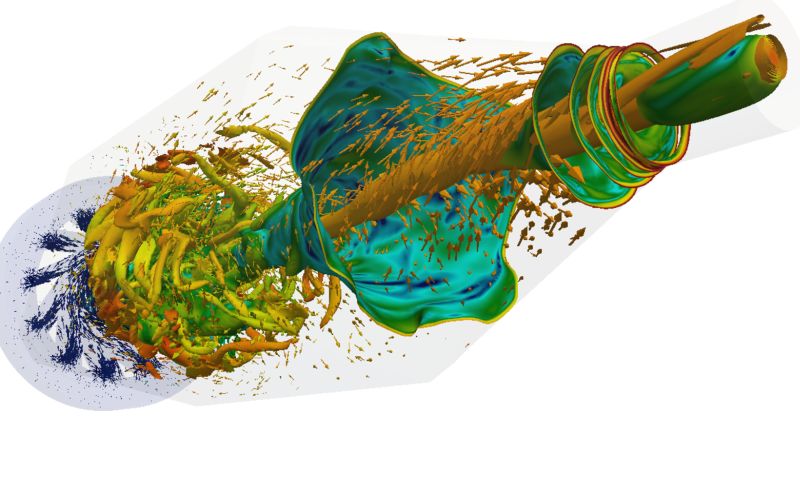
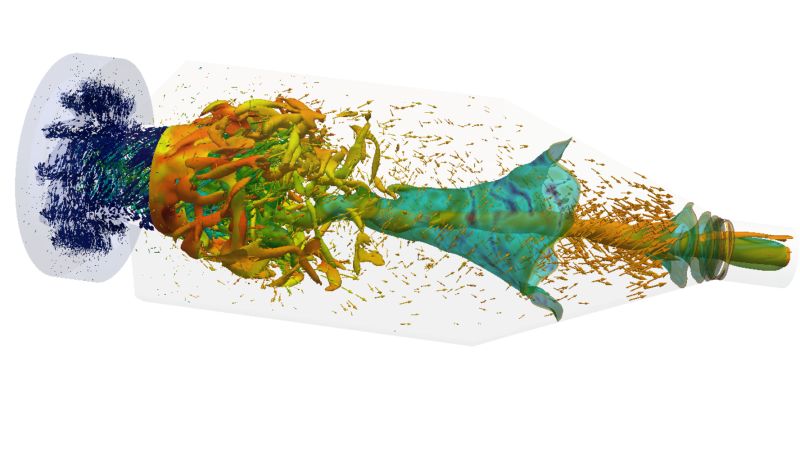
30. Music, order and chaos in a combustion chamber
30. Music, order and chaos in a combustion chamber
Mr Ivan Langella, University of Cambridge, Department of Engineering.
This picture shows the flow inside a gas turbine combustion chamber computed using ARCHER. The swirling flow enters the
chamber from the left as indicated by the arrows and evolves to become chaotic in the early part of the chamber, where vortical
structures, colored by temperature, can be observed. A trumpet-like iso-pressure surface surrounded by this chaos is produced by
the flow accelerating towards the exit because of the interaction between flame and turbulence. One can see order emerging from the
chaos resulting in a beautiful flow structure. Understanding this interaction helps to construct "silent" combustors for future
environmentally friendly gas turbine engines.
Colors represent temperature (red - high, blue - low) for vortical structures and velocity vectors, and vorticity on the iso-pressure surfaces.
-
31. Music, order and chaos in a combustion chamber
31. Music, order and chaos in a combustion chamber
Mr Ivan Langella, University of Cambridge, Department of Engineering.
This picture shows the flow inside a gas turbine combustion chamber computed using ARCHER. The swirling flow enters the
chamber from the left as indicated by the arrows and evolves to become chaotic in the early part of the chamber, where vortical
structures, colored by temperature, can be observed. A trumpet-like iso-pressure surface surrounded by this chaos is produced by
the flow accelerating towards the exit because of the interaction between flame and turbulence. One can see order emerging from the
chaos resulting in a beautiful flow structure. Understanding this interaction helps to construct "silent" combustors for future
environmentally friendly gas turbine engines.
Colors represent temperature (red - high, blue - low) for vortical structures and velocity vectors, and vorticity on the iso-pressure surfaces.