


8. I/O on ARCHER
- Common I/O Patterns
- Lustre parallel file systems
- Do I have a problem with my I/O?
- Summary of performance advice
- File Per Process (FPP)
- Single Shared File (SSF)
- I/O Profiling
This section provides information on getting the best performance out
of the parallel
/work
file systems on ARCHER when writing data, particularly using parallel
I/O patterns.
Bear in mind that /work is a shared filesystem so performance may vary and in particular there is no magic recipe for obtaining the best I/O performance. Some experimentation is typically required.
Common I/O Patterns
Single file, single writer (Serial I/O)
A common approach is to funnel all the I/O through a single master process. Although this has the advantage of producing a single file, the fact that only a single client is doing all the I/O means that it gains little benefit from the parallel file system.
File-per-process (FPP)
One of the first parallel strategies people use for I/O is for each parallel process to write to its own file. This is a simple scheme to implement and understand but has the disadvantage that, at the end of the calculation, the data is spread across many different files and may therefore be difficult to use for further analysis without a data reconstruction stage.
Single file, multiple writers without collective operations
There are a number of ways to achieve this. For example, many processes can open the same file but access different parts by skipping some initial offset; parallel I/O libraries such as MPI-IO, HDF5 and NetCDF also enable this.
Shared-file I/O has the advantage that all the data is organised correctly in a single file making analysis or restart more straightforward.
The problem is that, with many clients all accessing the same file, there can be a lot of contention for file system resources.
Single Shared File with collective writes (SSF)
The problem with having many clients performing I/O at the same time is that, to prevent them clashing with each other, the I/O library may have to take a conservative approach. For example, a file may be locked while each client is accessing it which means that I/O is effectively serialised and performance may be poor.
However, if I/O is done collectively where the library knows that all clients are doing I/O at the same time, then reads and writes can be explicitly coordinated to avoid clashes. It is only through collective I/O that the full bandwidth of the file system can be realised while accessing a single file.
Schemes benchmarked
As seen above, there are a number of different types of I/O that could be considered; we have limited ourselves to providing information for write performance in the following cases:
- File Per Process (FPP)
- One binary file written per parallel process. In this scenario we have investigated performance for standard unformatted Fortran writes.
- Single Shared File (SSF) with collective writes
- One binary file written to collectively by all parallel processes. In this scenario we have investigated performance using MPI-IO, parallel NetCDF, and parallel HDF5.
We have only considered write performance in the first instance as this is usually the critical factor for performance in parallel modelling or simulation applications.
Note: We have not yet included the NetCDF or HDF5 data below but will add this shortly.
Lustre parallel file systems
The ARCHER
/work
file systems use the Lustre parallel file system technology. The Lustre
filesystem provides POSIX semantics (changes on one node are
immediately visible on other nodes) and can support very high data
rates for appropriate I/O patterns.
Lustre basic concepts
In order to understand how Lustre behaves, it is useful to understand a few fundamental features of how it is constructed.
- Each /work filesystem comprises around 50 separate storage units called Object Storage Targets (OSTs); each OST can write data at around 500 MB/s. You can think of an OST as being a disk, although in practice it may comprise multiple disks, e.g. in a RAID array.
- An individual file can be stored across multiple OSTs; this is called striping. The default is to stripe across 4 OSTs, although this can be changed by the user.
- Every ARCHER node is a separate filesystem client; good performance is achieved when multiple clients simultaneously access the file system.
- There is a single MetaData Server (MDS) which stores global information such as the directory structure and which OSTs a file is stored on. Operations such as opening and closing a file can require dedicated access to the MDS and it can become a serial bottleneck in some circumstances.
- Parallel file systems are typically optimised for high bandwidth: they work best with a small number of large, contiguous IO requests rather than a large number of small ones.
Users have control of a number of settings on Lustre file systems including the striping settings. Although these parameters can be set on a per-file basis they are usually set on directory where your output files will be written so that all output files inherit the settings.
Stripe settings for a directory (or file) can be set using the
lfs setstripe
command.
You can query the stripe settings for a directory (or file) using the
lfs getstripe
command.
Setting the striping parameters correcty is a key part of getting the best write performance for your application on Lustre. There are two parameters that you need to be concerned with: stripe count and stripe size. Generally, the stripe count has a larger impact on performance than the stripe size.
To get best performance from Lustre it is best to match your I/O transfer size to the stripe size or multiples of the stripe size. It is also helpful if the I/O is aligned to 1 MiB boundaries.
Stripe Count
The stripe count sets the number of OSTs (Object Storage Targets) that Lustre stripes the file across. In theory, the larger the number of stripes, the more parallel write performance is available. However, large stripe counts for small files can be detrimental to performance as there is an overhead to using more stripes.
Stripe count is set using the
-c
option to
lfs setstripe
. For example, to set a stripe count of 1 for directory
res_dir
you would use:
auser@eslogin006:~> lfs setstripe -c 1 res_dir/
The special value '-1' to the stripe count tells Lustre to use maximum striping.
We have investigated stripe counts of 1, 4 (the default), and -1 (maximum striping).
FPP Note: Using multiple stripes with large numbers of files (for example in a FPP scheme with large core counts) can cause problems for the file system causing your jobs to fail and also may impact other users in a large way. We strongly recommend that you use a stripe count of 1 when using a FPP scheme.
SSF Note: In contrast to the FPP scheme, to get best
performance using a SSF scheme you should use maximal striping (
-c -1
). In this case, this does not cause issues for the file system as
there are only a small number of files open.
Stripe Size
The size of each stripe generally has less of an impact on performance than the stripe count but can become important as the size of the file being written increases.
Stripe size is set using the
-s
option to
lfs setstripe
. For example, to set a stripe size of 4 MiB for directory
res_dir
along with maximum striping you would use:
auser@eslogin006:~> lfs setstripe -s 4m -c -1 res_dir/
Note that the
-s
option understands the following suffixes: 'k': KiB, 'm': MiB, 'g':
GiB.
We have investigated stripe sizes of 1 MiB (the default), 4 MiB, and 8 MiB.
ARCHER /work default stripe settings and OST counts
Each of the three Lustre
/work
file systems on ARCHER has the same default stripe settings:
- A default stripe count of 4
- A default stripe size of 1 MiB (1048576 bytes)
These settings have been chosen to provide a good compromise for the wide variety of I/O patterns that are seen on the system but are unlikely to be optimal for any one particular scenario.
The total available number of OSTs available on each file system are as follows:
- fs2: 48
- fs3: 48
- fs4: 56
How can I find out which file system I am on?
All projects have their
/work
directory on one of the three Lustre file systems. You can find out
which one your project uses on ARCHER by moving the your
/work
directory and using the
readlink
command:
auser@eslogin006:~> cd /work/t01/t01/auser
auser@eslogin006:/work/t01/t01/auser> readlink -f .
/fs3/t01/t01/auser
So project 't01' uses the 'fs3' Lustre file system.
Do I have a problem with my I/O?
The first thing to do is to time your I/O and quantify it in terms of bytes per second (usually MiB/s or GiB/s). This does not have to be particularly accurate - something correct to within a factor of two should highlight whether or not there is room for improvement.
- If your aggregate I/O bandwidth is much less than 500 MiB/s then there could be room for improvement; if it is more than several GiB/s then you are already doing rather well.
What can I measure and tune?
I/O performance can be quite difficult to understand, but there are some simple experiments you can do to try to uncover the sources of any problems.
First, look at how your I/O rate changes as you scale your code to increasing numbers of processes.
- If the I/O rate stays the same then you may be dominated by serial IO.
- If the I/O rate drops significantly then you may be seeing contention between clients. This could be because you have too many files, or too many clients independently accessing the same file. See the summary of performance advice below for how to avoid this.
If you are using a SSF scheme, you can also look at how I/O scales with the number of OSTs across which each file is striped (the stripe count makes little difference if you are using an FPP scheme). It would be best to run with several hundred processes so that you have sufficient Lustre clients to benefit from striping (remember that each ARCHER node is a client).
It is probably easiest to set striping per directory, which affects all files subsequently created in it, and delete all existing files before re-running any tests. For example, to set a directory to use 8 stripes:
user@archer> lfs setstripe -c 8 <directory>
Run tests with, for example, 1 stripe, 4 stripes (the default), 8 stripes and full striping (stripe count of -1).
See the results below for examples of what the performance variation looks like with different stripe cound for the SSF scheme.
Summary of performance advice
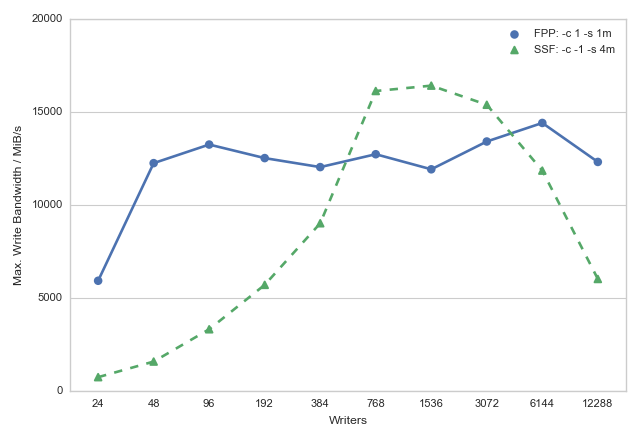
Our tests show that the maximum bandwidth you can expect to obtain from
the ARCHER Lustre
/work
file systems in practice is 15-17 GiB/s, irrespective
of whether you use a FPP or SSF approach (the theoretical maximum
performance is 30 GiB/s for fs2 and fs3 and 35 GiB/s for fs4).
We provide detailed performance numbers for the different schemes below and provide a high-level summary here.
- For serial I/O with the default settings you should be able to saturate the bandwidth of a single OST, i.e. achieve around 500 MiB/s. You may be able to increase this by increasing the stripe size above its default of 1 MiB.
- Do not stripe small files or large collections of small files (for example source code). Use a directory with a stripe count of 1.
- For performance, we would recommend that users use a FPP scheme in most cases. It gives good, reliable performance for a wide range of process counts. (This may, however, add complexity in analysing or reusing the data.)
- When using FPP you should explictly set a stripe count of 1 (
-c
			1
) as it provides excellent performance, minimises chances of job crashes, and has minimum impact on other users. - When using SSF you should set maximum stripe count (
-c -1) as this is required for performance. - If you are using MPI-IO in a SSF scheme you must ensure that you are using collective I/O to get good performance. I/O libraries such as MPI-IO, NetCDF and HDF5 can all implement collective IO but it is not necessarily the default - in general you need to check the documentation. For example, in MPI-IO the routines ending _all are always collective; you can specify the behaviour in NetCDF via the call nc_var_par_access.
- The stripe size for SSF depends on the amount of data being written. The larger the data being written, the larger the stripe size should be used. Please see the more detailed information provided below.
Plot comparing maximum achieved write bandwiths on ARCHER fs3 for FPP and SSF parallel I/O schemes:
File Per Process (FPP)
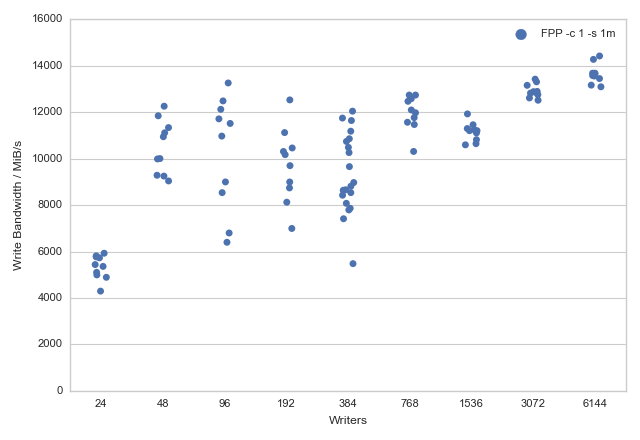
The data below show the maximum measured write bandwidths (in MiB/s) for the FPP scheme using unformatted Fortran writes with different numbers of parallel processes.
These writes corresponded to:
- 1024 MiB written per process
- Fully-populated ARCHER nodes (24 processes per node)
A large amount of data needs to be written by each process to make sure that the aggressive caching and buffering of I/O by the Fortran I/O library is avoided.
In summary:
- Using FPP we can quickly get high levels of performance for the ARCHER Lustre file systems (just 2 nodes, 48 processes, can give a write performance in excess of 12 GiB/s)
Plot of write bandwidth distributions for ARCHER fs3 using the FPP scheme:
| Number of Processes | Stripe Count | Stripe Size (MiB) | Max. Write Bandwidth (MiB) |
|---|---|---|---|
| 24 | 1 | 1 | 5929 |
| 48 | 1 | 1 | 12261 |
| 96 | 1 | 1 | 13262 |
| 192 | 1 | 1 | 12532 |
| 384 | 1 | 1 | 12048 |
| 768 | 1 | 1 | 12741 |
| 1536 | 1 | 1 | 11930 |
| 3072 | 1 | 1 | 13426 |
| 6144 | 1 | 1 | 14425 |
Single Shared File (SSF)
MPI-IO
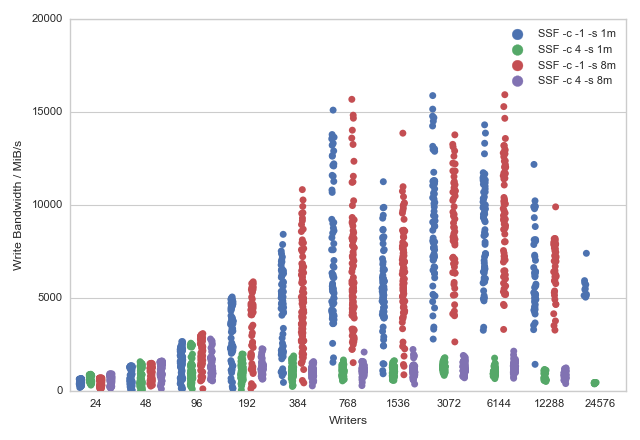
The data below show the maximum measured write bandwidths (in MiB/s) for the SSF scheme using MPI-IO collective writes with different numbers of parallel processes. These writes corresponded to:
- 16 MiB written per process
- Fully-populated ARCHER nodes (24 processes per node)
Less data is required per process in the SSF scheme compared to the FPP scheme as MPI-IO does not employ the agressive buffering seen in the Fortran I/O library.
In summary:
- Below 96 processes the defaut stripe count of 4 gives the best performance
- Above 96 processes maximal striping (
-c -1) should be used to get best performance - MPI-IO collective operations are required to see good performance
- Single striping (
-c 1) was not explored in detail as the performance was so low that it made running large tests problematic.
A more detailed study of the performance of SSF schemes can be found in the ARCHER White Paper: Performance of Parallel IO on ARCHER
Plot of write bandwidth distributions for ARCHER fs3 using the SSF scheme:
| Number of Processes | Stripe Count | Stripe Size (MiB) | Max. Write Bandwidth (MiB) |
|---|---|---|---|
| 24 | -1 | 1 | 662 |
| 48 | -1 | 1 | 1311 |
| 96 | -1 | 1 | 2270 |
| 192 | -1 | 1 | 3791 |
| 384 | -1 | 1 | 5396 |
| 768 | -1 | 1 | 5775 |
| 1536 | -1 | 1 | 5945 |
| 3072 | -1 | 1 | 11321 |
| 6144 | -1 | 1 | 11530 |
| 12288 | -1 | 1 | 6368 |
| Number of Processes | Stripe Count | Stripe Size (MiB) | Max. Write Bandwidth (MiB) |
|---|---|---|---|
| 24 | -1 | 8 | 691 |
| 48 | -1 | 8 | 1487 |
| 96 | -1 | 8 | 3085 |
| 192 | -1 | 8 | 5587 |
| 384 | -1 | 8 | 7663 |
| 768 | -1 | 8 | 9108 |
| 1536 | -1 | 8 | 8599 |
| 3072 | -1 | 8 | 13785 |
| 6144 | -1 | 8 | 15946 |
| 12288 | -1 | 8 | 8205 |
| Number of Processes | Stripe Count | Stripe Size (MiB) | Max. Write Bandwidth (MiB) |
|---|---|---|---|
| 24 | 4 | 1 | 862 |
| 48 | 4 | 1 | 1313 |
| 96 | 4 | 1 | 1292 |
| 192 | 4 | 1 | 1585 |
| 384 | 4 | 1 | 881 |
| 768 | 4 | 1 | 924 |
| 1536 | 4 | 1 | 822 |
| 3072 | 4 | 1 | 1288 |
| 6144 | 4 | 1 | 946 |
| Number of Processes | Stripe Count | Stripe Size (MiB) | Max. Write Bandwidth (MiB) |
|---|---|---|---|
| 24 | 4 | 8 | 915 |
| 48 | 4 | 8 | 1565 |
| 96 | 4 | 8 | 1789 |
| 192 | 4 | 8 | 1753 |
| 384 | 4 | 8 | 1251 |
| 768 | 4 | 8 | 1553 |
| 1536 | 4 | 8 | 1355 |
| 3072 | 4 | 8 | 1650 |
| 6144 | 4 | 8 | 1939 |
I/O Profiling
You can profile your application to get an insight into the I/O behaviour. CrayPAT can profile I/O tracing for specific I/O APIs by specifying particular flags (for example pat build -g io ... ) A default perftools-lite run will also include some I/O profiling.
Simple I/O data can be obtained from the iobuf module, it can also be used to provide additional buffering.
If you are using MPI-IO (or NetCDF or HDF5) then you can set MPICH_MPIIO_STATS to obtained I/O statistics (see man mpi).